Spectrally resolved OLR
Our understanding of the Earth’s climate system and our ability to model future climate changes relies on accurate measurements of the Earth’s Outgoing Longwave Radiation (OLR) (W m-2) at the top of the atmosphere (TOA) (i.e. the radiation emitted by the Earth-atmosphere system and leaving to space). While OLR has been monitored by dedicated broadband instruments for more than four decades, these only provide spectrally integrated OLR over a broad spectral range which makes it difficult to assess the individual impact of the different climate drivers (especially greenhouse gases) and to track down deficiencies in climate models. A better constraint can, in principle, be obtained from spectrally resolved OLR (W m-2 cm-1) (i.e. the integrand of broadband OLR) derived from hyperspectral infrared sounders by giving access to the spectral signature of particular climate feedbacks and processes.
Method
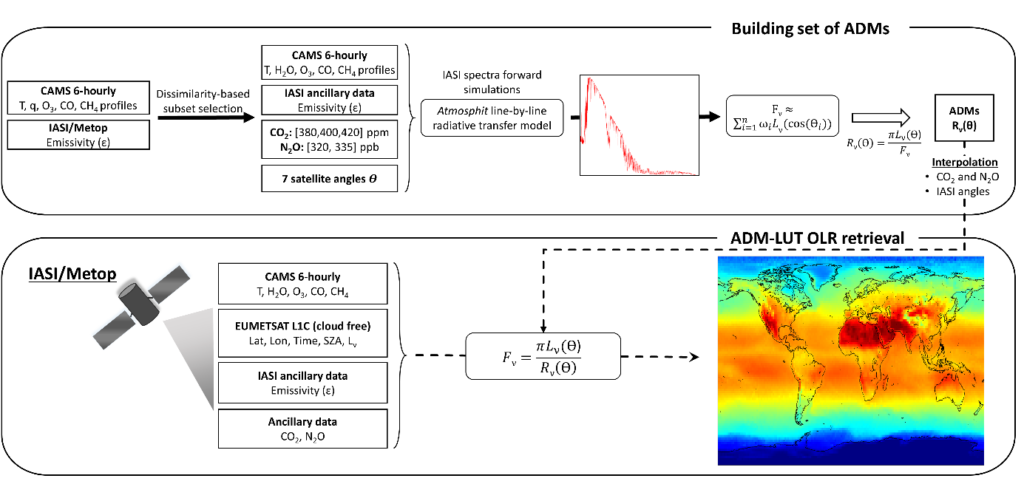
A first achievement was the development of a dedicated algorithm for the estimation of the spectrally resolved OLR from radiance measurements (W m-2 cm-1 sr-1) made by the IASI sounder on board the Metop satellites. The spectral OLR is derived at the spectral sampling of the instrument (0.25 cm-1) in the range 645-2300 cm-1. To the best of our knowledge, no other OLR product exists for IASI measurements. It is also the first time that OLR is derived at such spectral resolution, with any instrument. The method is described in details in a paper published in the Journal of Climate (Whitburn, et al. 2020) and is summarized in Figure 1.1. It relies, as most of other OLR retrieval algorithms, on the use of pre-calculated empirical angular distribution models (ADMs) that directly link the directional radiance measurement to the corresponding OLR. These ADMs were developed from synthetic spectra for a large selection of scene types (more than 140,000 in total) associated with different states of the atmosphere and the surface. In total, 10 years of IASI derived spectral OLR have been processed globally (2° by 2° grid) on a daily basis.
Short-term trends in the spectral OLR
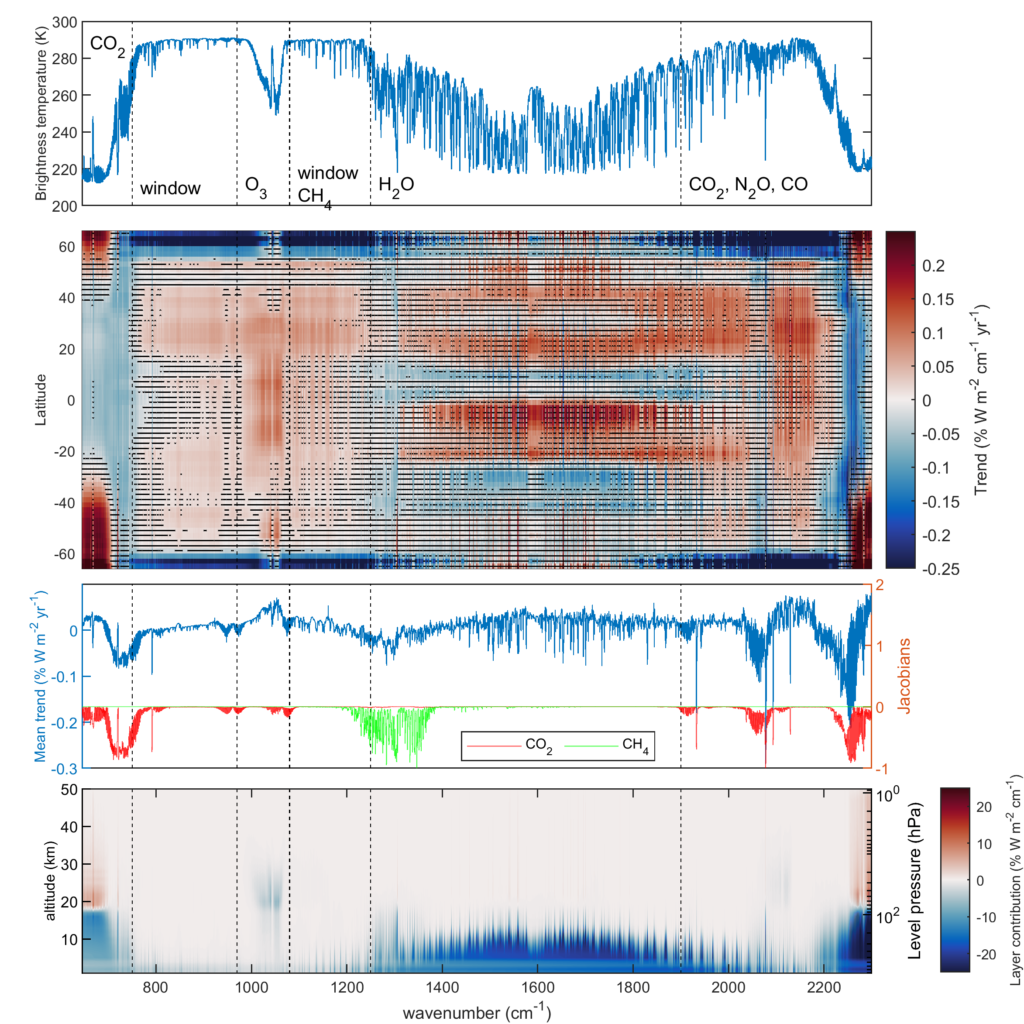
We next started to use the IASI data to analyze short-term trends in the spectral OLR. The key figure of the study is presented below (Figure 1.2) and shows the spectral trends calculated from the longitude averaged daily spectral OLR (sea measurements only) between 2008 and 2017 (second panel). A first analysis reveals immediately: 1) a positive trend in the window region band (except at high latitude) due to the increasing surface temperature and 2) a negative trend in the CO2 band forced by the increases in CO2 concentrations (stratospheric cooling). A deeper analysis is carried out, by looking in parallel at the IASI channel layer contribution (Figure 2, bottom panel) – representing basically the altitude from which most radiation observed at the TOA comes from –, which should allow to identify and explain the changes in OLR in the spectral bands influenced by the main drivers of climate change (e.g. CO2, CH4, H2O, N2O, etc.). The outcomes should be of great value for modelers to help them in better constraining their climate models.
Interannual variations in the spectral OLR
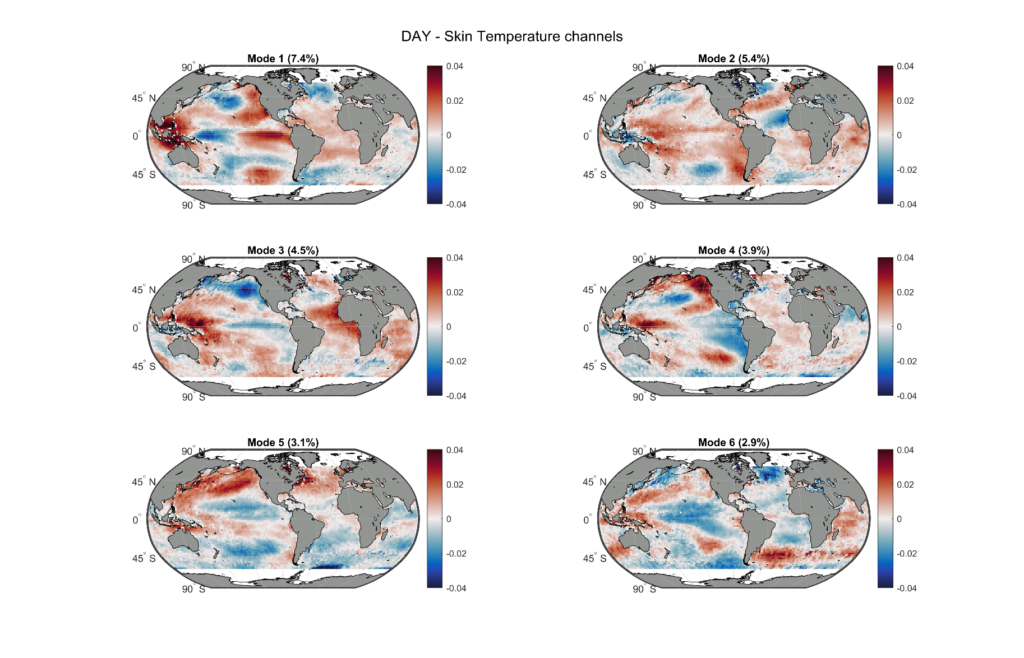
The second study, on the interannual variations in the spectral OLR, investigates the correlation between the OLR and well-known climate factors. Some meaningful questions that will be investigated include: 1) what are the climate phenomena that influence the most the interannual variability of OLR in different spectral bands? 2) Are these phenomena independent or intercorrelated? We rely for this on Empirical Orthogonal Function (EOF) analysis of global spectral OLR. An example of global EOF spatial patterns of the first six OLR modes (skin temperature channels) calculated for the 2008-2017 period is shown in Figure 1.3. The first mode appears to be highly correlated with the El Niño–Southern Oscillation (ENSO), the Pacific Decadal Oscillation (PDO) and the El Niño Modoki Index (EMI) for the period considered.
A new IASI cloud mask for climate applications
Accurate detection of cloud-free scenes from satellite measurements is an essential preprocessing step for most climate and atmospheric satellite applications, including for deriving the Earth outgoing longwave radiation (OLR) budget, as the presence of even small cloud amounts in the instrument field of view will significantly impact the radiance at the top of the atmosphere.
For the detection and the characterization of the clouds in the field of observation of IASI, several products already exist. However, while these are of very good quality, they are generally either not homogeneous on the whole IASI time series or not strict enough in the cloud detection for use in satellite data retrieval schemes of geophysical variable.
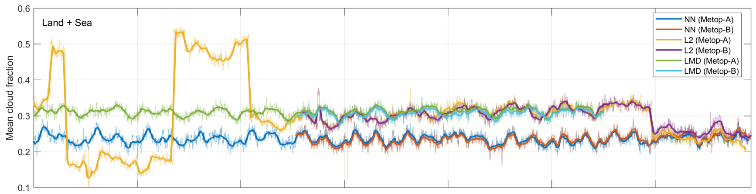
Because of the limitations in the existing products, we developed a new cloud detection algorithm which combines (1) a high sensitivity, (2) a good consistency over the whole IASI time series and between the different copies of the instrument flying on board the suite of Metop satellites, and (3) simplicity in its parametrization. The method is described in detail in a paper published in Atmospheric Measurement Techniques (Whitburn et al., 2022). It is based on a supervised neural network (NN) and relies, as input parameters, on the IASI radiance measurements only. The robustness of the cloud mask over time is ensured by avoiding the IASI channels that are influenced by CO2, N2O, CH4, CFC-11 and CFC-12 absorption lines and those corresponding to the ν2 H2O absorption band. As a reference dataset for the training, version 6.5 of the operational IASI Level 2 (L2) cloud product is used. The consistency of the cloud product over time is illustrated in Figure 1. The algorithm has now been implemented in several IASI retrieval framework, including the spectrally resolved Outgoing Longwave Radiation product.
Data access
Outgoing Longwave Radiation data are available here.
Bibliography
Whitburn, S., L. Clarisse, S. Bauduin, M. George, D. Hurtmans, S. Safieddine, P.F. Coheur, and C. Clerbaux. 2020. « Spectrally resolved fluxes from IASI data: Retrieval algorithm for clear-sky measurements. » Journal of Climate. https://doi.org/10.1175/JCLI-D-19-0523.1
Whitburn, S. ; Clarisse, L. ; Bouillon, M. ; Safieddine, S.; George, M.; Dewitte, S.; De Longueville, H. ; Coheur, P.-F. & Clerbaux, C. Trends in spectrally resolved outgoing longwave radiation from 10 years of satellite measurements. npj Climate and Atmospheric Science, 2021. https://doi.org/10.1038/s41612-021-00205-7
Whitburn, S., Clarisse, L., Crapeau, M., August, T., Hultberg, T., Coheur, P. F., and Clerbaux, C.: A CO2-independent cloud mask from Infrared Atmospheric Sounding Interferometer (IASI) radiances for climate applications, Atmos. Meas. Tech., 15, 6653–6668, https://doi.org/10.5194/amt-15-6653-2022