IASI-derived surface temperature dataset for climate studies
Sea surface temperature (SST) is an essential variable for monitoring climate. Satellite data are able to provide systematic global temperature data, at least in cloud-free areas, from pole to pole on a regular basis. Satellites do not measure the near-surface air temperature; instead they measure the skin temperature, a different physical parameter. Emissivity of the surface, which is a function of surface type, viewing angle and wavelength, and temperature, is a primary variable affecting the upwelling radiance. Over the sea, the emissivity is close to one. Above land, accounting for variations in surface emissivity correctly will be essential. For this task, we will carefully select radiative channels in the atmospheric windows, where the atmosphere is relatively transparent for cloud-free scenes. This dataset is used along with appropriate statistical tools to derive accurate skin temperatures locally across the whole globe. Satellite measurements can offer global continuous SST measurements, but their stability over time needs to be assured.
Method to derive sea surface temperature (SST)
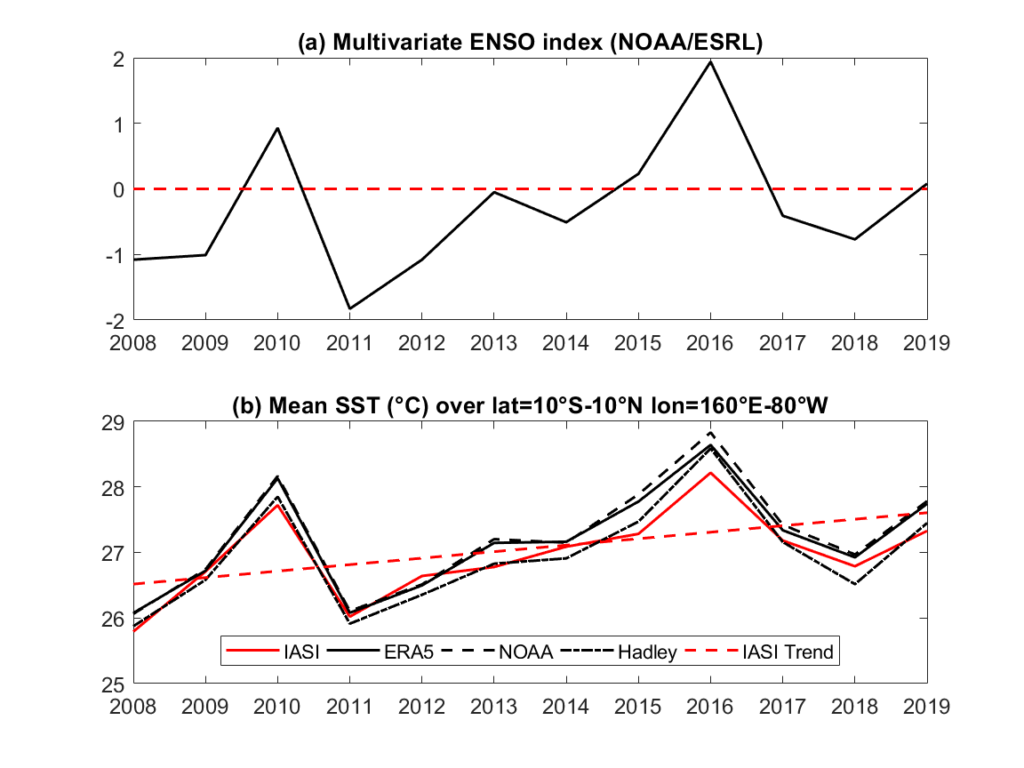
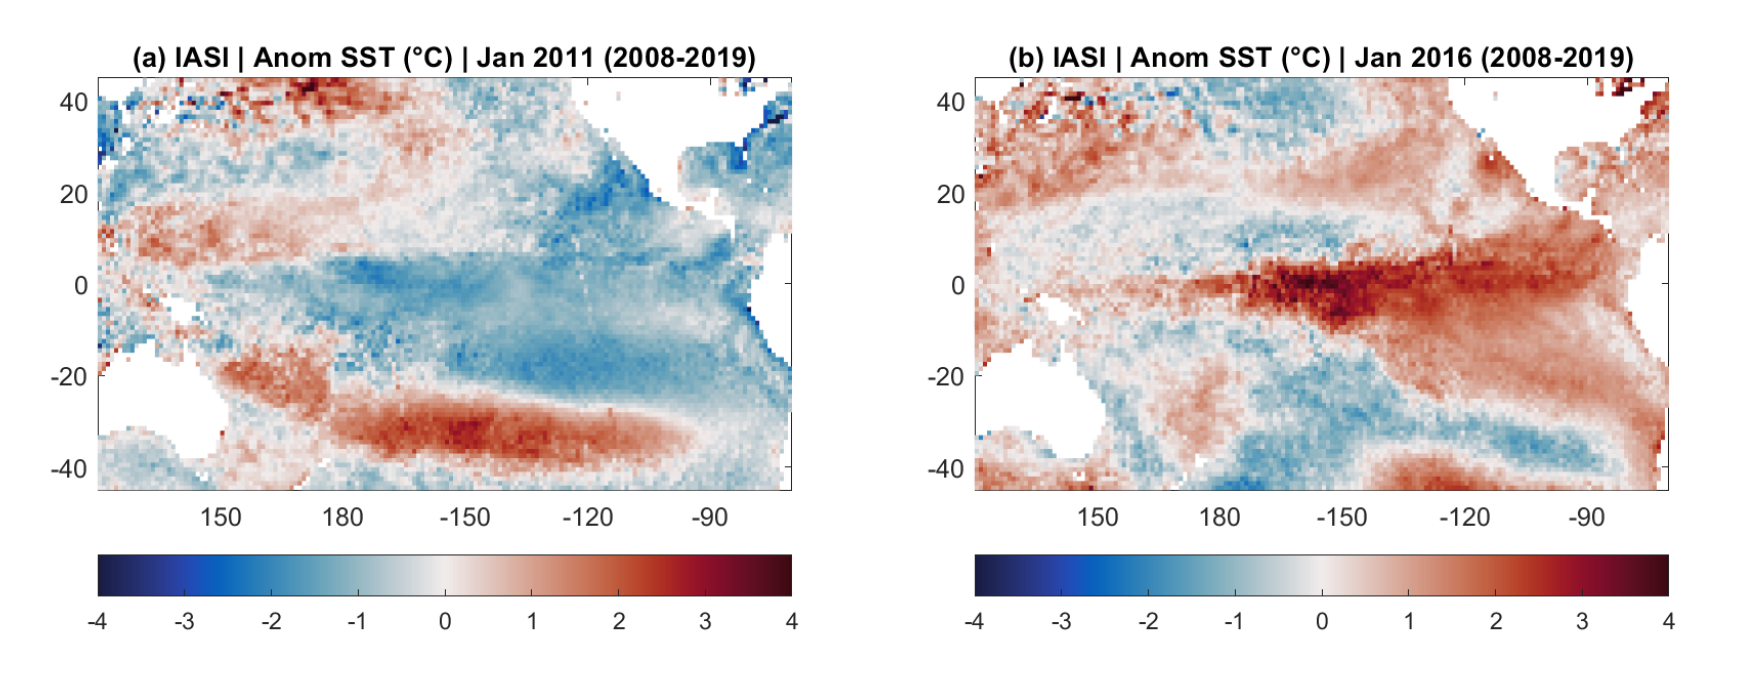
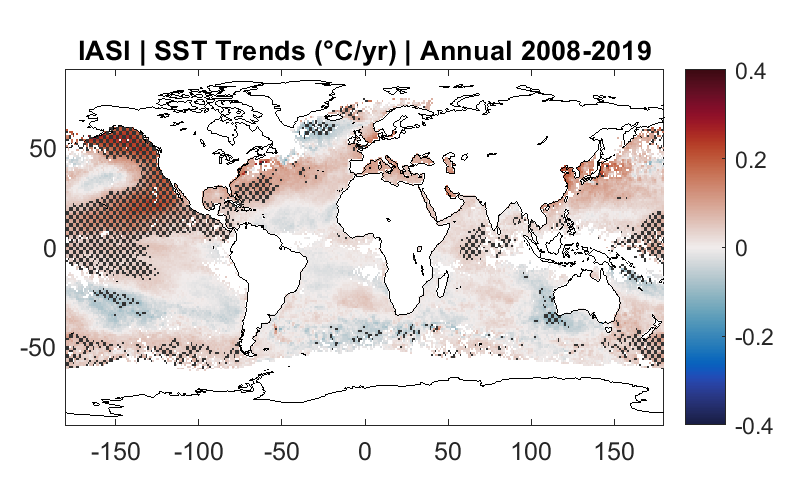
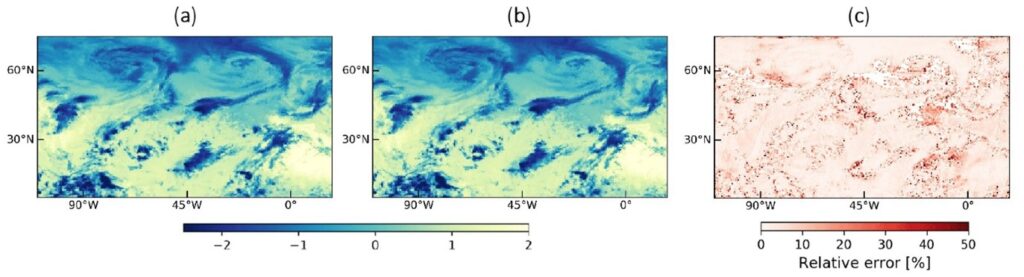
In this workpackage the goal was to create a new SST dataset derived from reprocessed (stable) IASI measurements, that could be used in climate studies, to determine trends and variability (e.g.: the El Niño Southern Oscillation, ENSO). The IASI SST was computed using Planck’s Law and simple atmospheric corrections, and compared to ECMWF’s ERA5, Hadley Center’s HadISST and NOAA’s OISSTv2. This comparison showed that our dataset produces similar means, variability and trends as other datasets. Features like the strong 2016 El Niño event (Figure 2.1 and Figure 2.2), the warming global trend (Figure 2.1) the cooling trend in the North Atlantic and the warming trend over the Mediterranean are captured well by the IASI dataset (Figure 2.3). However, the IASI SST has the added advantage that it is derived with a single algorithm from a single well-calibrated instrument. This insures there are no substantial changes to the instrument characteristics over time that might result in artificial trends and variability.
Method to derive temperature over land and sea
Another method was used to retrieve skin temperature over land and sea using IASI radiances. The method is two-step. First a rigorous analysis based on information theory and entropy reduction technique has been performed on the IASI spectral channels to determine those with the highest information content relevant to skin temperature retrieval. Second, these selected channels were used as input in an artificial neural network training. The training is performed with clear-sky IASI radiances with ECMWF latest reanalysis (ERA5) skin temperature product as target. Once the network is built, it was applied to the IASI record.
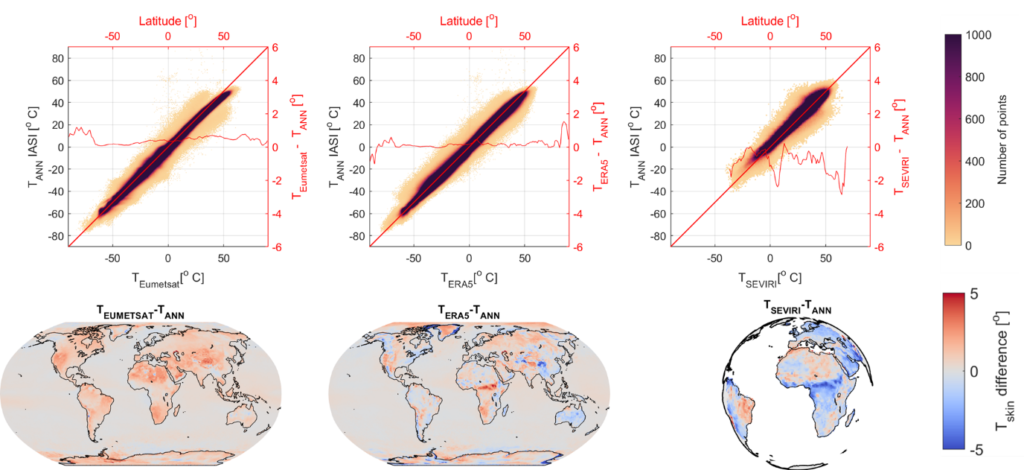
The Tskin product was then validated with different widely used data sets, such as ERA5, EUMETSAT, and SEVIRI satellite product, and with ground based measurements from two different set of in-situ station data. The results show the potential of ANN in mapping radiances globally and locally to skin temperature. When the IASI Tskin product is compared with that of other datasets (Figure 2.4), a mean bias and STDE (i.e., [bias, STDE]) of [0.55, 1.86°C], [0.19, 2.10°C], [-1.5, 3.56°C], is found from EUMETSAT IASI L-2 product, ERA5, and SEVIRI. More detailed statistical analysis was done with ground measurements. First, with Gobabeb station data, which location is in the Namibian desert, it was demonstrated that the required accuracy needed for climate trends construction is reached. At the SURFRAD’s network stations, which cover different locations in the United states, the accuracy found largely depends on the location of the station. The bias was the largest when the IASI (or ERA5) coincident observation is over a heterogeneous land cover.
Applications
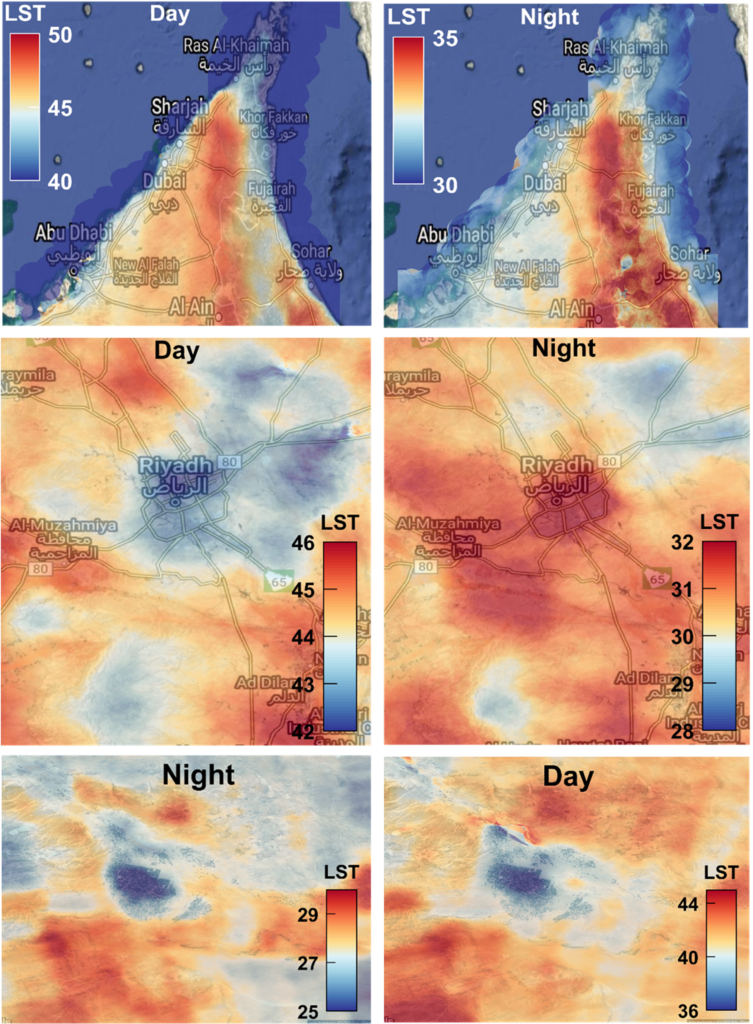
1. The Arabian Peninsula : different land cover types with variable Tskin
The Tskin product is analyzed over a particular region of the world, the Arabian Peninsula. Here, the Tskin can be analyzed with different land covers: over the coasts (e.g. the city of Dubai), over cities that can act both as a cool or heat islands (such as the capital of Saudi Arabia, Riyadh, which is an urban heat island at night and urban cool island during the day), and over agricultural irrigated soil, which exhibits cooler skin temperatures than the surrounding (Safieddine et al. 2022).
2. IASI and machine learning for cyclone detection
Using the same channel selection that was used to retrieve Tskin, and refining it, we provide a proof of concept of the possibility of constructing images required by the machine learning YOLOv3 model from IASI. We constructed a dataset by selecting 50 IASI radiance channels and used them to create images, which we labeled by constructing bounding boxes around tropical cyclones using the hurricane database HURDAT2. We trained the YOLOv3 on two settings, first with three “best” selected channels, then using an autoencoder to exploit all 50 channels. We assessed its performance with the Average Precision (AP) metric at two different intersection over union (IoU) thresholds (0.1 and 0.5). The model achieved promising results with AP at IoU threshold 0.1 of 78.31%. Lower performance was achieved with IoU threshold 0.5 (31.05%), showing the model lacks precision regarding the size and position of the predicted boxes. Despite that, we show YOLOv3 demonstrates great potential for tropical cyclones detection using IASI and more generally, using thermal infrared instruments data (Lam et al.; 2023).
Data access
Sea Surface Temperature data are available here.
Skin Temperature data are available here.
Bibliography
Safieddine S., Parracho A. C., George M., Aires F., Pellet V., Clarisse L., Whitburn S., Lezeaux O., Thepaut J.-N., Hersbach H., Radnoti G., Goettsche F., Martin M., Doutriaux Boucher M., Coppens D., August T., Zhou D.K. and Clerbaux C.: Artificial Neural Networks to retrieve land and sea skin temperature from IASI, Remote Sensing, 12(17), 2777, https://doi.org/10.3390/rs12172777, 2020.
Parracho, A.C., Safieddine, S., Lezeaux, O., Clarisse, L., Whitburn, S., George, M., et al. (2021). IASI-derived sea surface temperature data set for climate studies. Earth and Space Science, 8, e2020EA001427. https://doi.org/10.1029/2020EA001427
Safieddine, S., Clerbaux, C., Clarisse, L., Whitburn, S., & Eltahir, E. A. B. (2022). Present and future land surface and wet bulb temperatures in the Arabian Peninsula. Environmental Research Letters, 17(4), 044029. https://doi.org/10.1088/1748-9326/ac507c
Lam, L.; George, M.; Gardoll, S.; Safieddine, S.; Whitburn, S.; Clerbaux, C. Tropical Cyclone Detection from the Thermal Infrared Sensor IASI Data Using the Deep Learning Model YOLOv3. Atmosphere 2023, 14, 215. https://doi.org/10.3390/atmos14020215