Temperature profiles can be obtained from IASI radiances using CO2 absorption bands at 15 µm (645-800 cm-1) and 4.3 µm (2250-2400 cm-1). Weighting functions from atmospheric radiative transfer models provide information regarding which radiance channel is sensitive to which altitudes.
Assessment of the stability of the radiance record
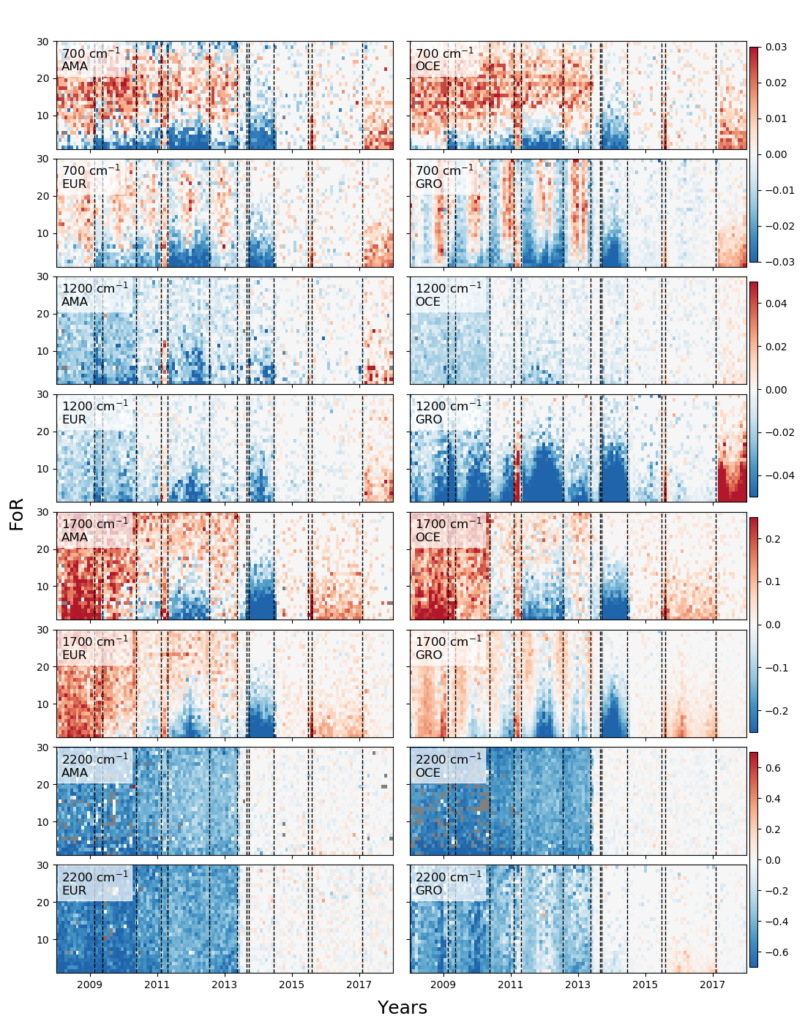
Since 2007, the processing of IASI data done by the EUropean organisation for the exploitation of METeorological SATellites (EUMETSAT) has improved, but due to IASI’s huge data flow, the whole dataset has not yet been reprocessed backwards. In 2019, EUMETSAT reprocessed IASI radiances with the latest version of the processing algorithm. We compared IASI operational radiances with the reprocessed ones to assess their homogeneity. In brightness temperatures, the differences between the two datasets range from 0.02 K at 700 cm-1 to 0.1 K at 2200 cm-1. Two updates in 2010 and 2013 had the largest impact on the evolution of radiances, see Figure 3.1.
Assessment of the stability of the temperature record
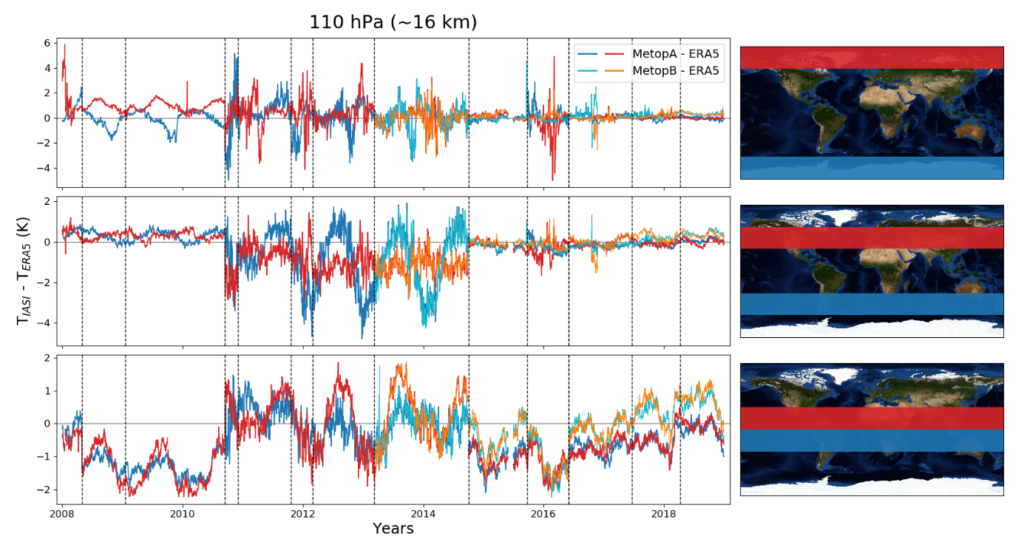
For temperatures, we compared IASI-A and B with ERA5 reanalysis temperatures. We found differences of ~5-10 K at the surface and between 1 and 5 K in the atmosphere (Figure 3.2). These differences decrease abruptly after the release of the IASI L2 processor version 6 in 2014.These results suggest that it is not recommended to use the IASI inhomogeneous temperature products for trend analysis, both for temperature and trace gas trends.
Computation of a new temperature record
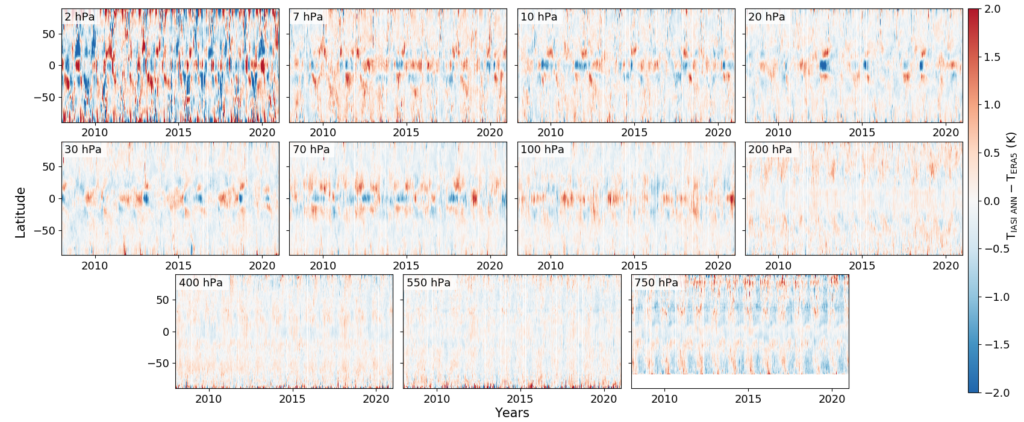
In order to compute a new homogeneous temperature record, we used a artificial neural network (ANN). The ANN was trained with IASI radiances as input and ERA5 atmospheric temperatures at 11 pressure levels as output. The retrieved temperatures were compared with ERA5 and ARSA for validation. We found a good agreement between the three datasets between 750 and 7 hPa, where IASI is most sensitive to temperature (differences up to 1 K). At 2 hPa, the IASI sensitivity decreases and the differences reach 2 K. Figure 3.3 show the differences between the ANN product and ERA5 at the 11 pressure levels.
Applications
1. Climate trends
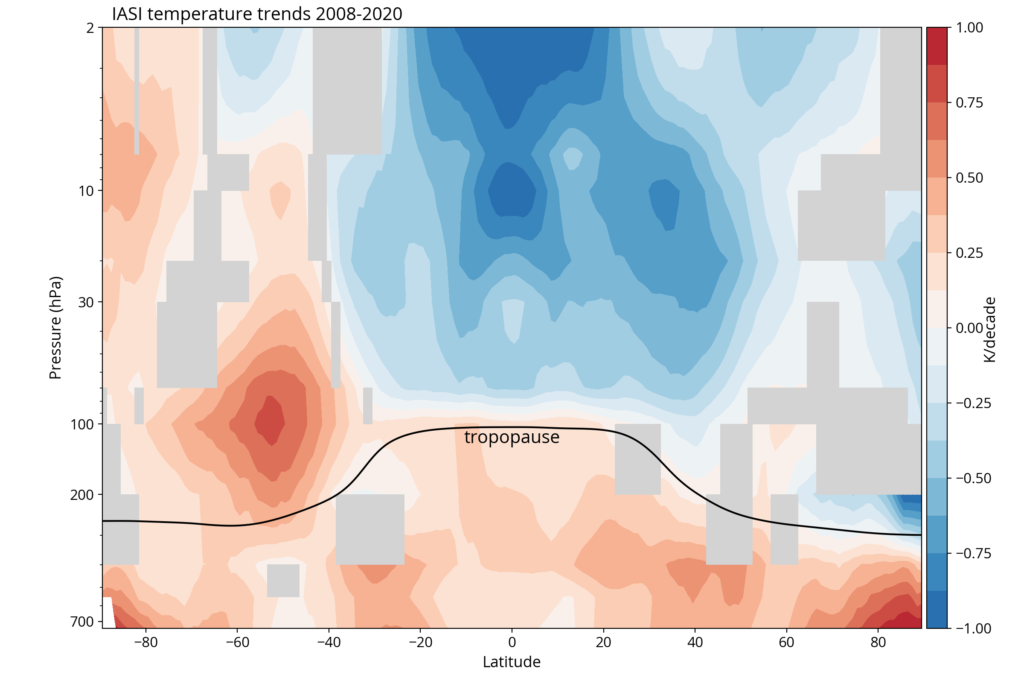
We used this new temperature time series to compute linear trends over the period 2008-2020 (figure 3.4.). We found that there is a general warming of the troposphere that is more important at the poles and mid-latitudes (0.5 K/decade at mid-latitudes, 1 K/decade at the North Pole). The stratosphere is globally cooling on average, except at the South Pole as a result of the ozone layer recovery and a sudden stratospheric warming in 2019. The cooling is most pronounced in the equatorial upper stratosphere (−1 K/decade).
2. Sudden Stratospheric Warmings events
Sudden Stratospheric Warming events (SSW) are extreme phenomena during which stratospheric temperature can increase by tens of degrees in a few days. They are due to the propagation and breaking of the planetary waves, leading to a perturbation of the polar vortex. SSWs also influence polar ozone concentrations and midlatitude weather. The temperature profiles derived in this project are used to observe the changes of temperature and their effect on ozone during SSWs. Since the launch of the first IASI, there have been several SSWs in the Northern Hemisphere, including eight major events that are investigated in this study.
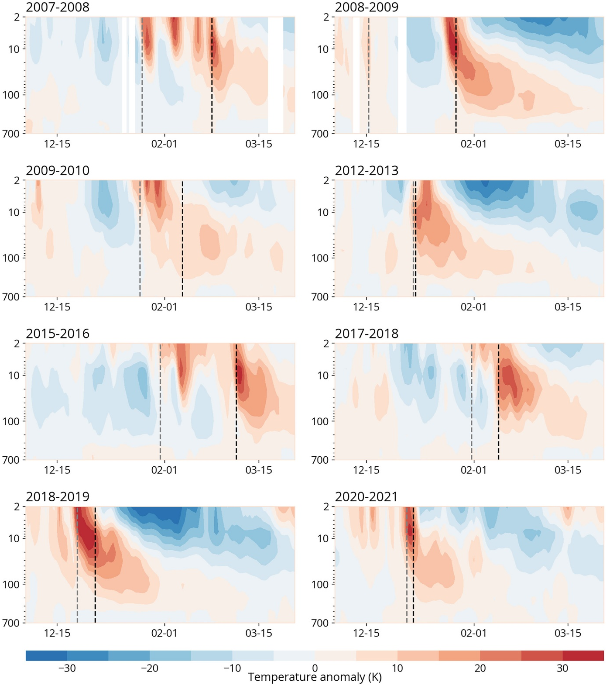
We find that during major SSWs, the temperature anomaly propagates from 10 hPa to the lower stratosphere and the maximum anomaly at 200 hPa is correlated to the maximum anomaly at 10 hPa. During these events, negative anomalies of temperature in Europe and Russia and positive anomalies in Canada and Greenland are often observed at 750 hPa. The cold air outbreaks that usually follow major SSWs are responsible for anomalies of −15 K. We look at the evolution of the total ozone column following major events. Major SSWs lead to higher springtime ozone concentrations and the ozone anomaly in March is correlated to the duration of the positive temperature anomaly at 10 hPa. These results show the potential of the IASI mission and its successors, IASI-New Generation, for the study of SSWs and their effects on weather and atmospheric composition (Bouillon et al., 2023).
Data access
Atmospheric Temperature Profiles data are available here.
Bibliography
Bouillon M., S. Safieddine, J. Hadji-Lazaro, S. Whitburn, L. Clarisse, M. Doutriaux-Boucher, D. Coppens, T. August, E. Jacquette and C. Clerbaux: Ten-year assessment of IASI radiances and temperatures, Remote Sensing, 12(15), 2393; https://doi.org/10.3390/rs12152393, 2020.
Bouillon, M., Safieddine, S., Whitburn, S., Clarisse, L., Aires, F., Pellet, V., Lezeaux, O., Scott, N. A., Doutriaux-Boucher, M., and Clerbaux, C.: Time evolution of temperature profiles retrieved from 13 years of infrared atmospheric sounding interferometer (IASI) data using an artificial neural network, Atmos. Meas. Tech., 15, 1779–1793, https://doi.org/10.5194/amt-15-1779-2022, 2022.
Bouillon, M., Safieddine, S., & Clerbaux, C. (2023). Sudden stratospheric warmings in the Northern Hemisphere observed with IASI. Journal of Geophysical Research: Atmospheres, 128, e2023JD038692. https://doi.org/10.1029/2023JD038692